Surely you must have heard of Elliott Wave Theory. Ralph Nelson Elliott, with his theory, wanted to convey that graphs can show the psychology of the people who make up the market. His theory stated that the emotional tensions that underlie the operations in a stock market are reflected through graphs in the form of waves that make up prices.
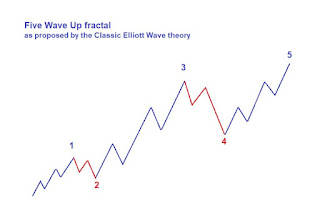
His theory is that the market consists of a bullish period composed of a first bullish stage that would be the 5-3 model: 5 waves called waves 1, 2, 3, 4 and 5 where wave 3 tends to be the largest of all but never the smallest. Moreover, wave three always exceeds in value to 1.
The second bearish stage is composed of 3 waves called a, b and c. Each step has impulse waves and their corrective waves. The ones that go in the direction of the trend are corrective, and those that go against the trend are an impulse.
In the first bullish stage, waves 1, 3, and 5 are bullish. Therefore they are in favor of the trend and are considered impulse waves. While 2 and 4 are not bullish, so they are deemed corrective waves. In the bearish stage the waves a and c are bearish, and the b, bullish.
Elliot waves became famous for representing a map of what could happen. It is the panacea you want to know how far the price can go if you can detect the correct wave. Today it is accepted worldwide, but when it came for the first time, it was very innovative, with its detractors.
To get an overview of the Elliott wave theory, it is imperative to know at what moment of the market we are in with regards to the waves. We are always based on a temporary period of investment. So, we can anticipate the movements of the market. Elliot waves became famous because they expect movements. To understand them better we can turn to theory: The rule of an alternation.
If we maintain this premise, financial markets do not always do the same, that is, if they have resistance zones or supports, this theory maintains that these zones do not repeat themselves. When we see the theory of Elliot waves, we have to take into account three questions:
Therefore, understanding these waves, as mentioned here, can offer a good overview of the Elliott wave theory!

His theory is that the market consists of a bullish period composed of a first bullish stage that would be the 5-3 model: 5 waves called waves 1, 2, 3, 4 and 5 where wave 3 tends to be the largest of all but never the smallest. Moreover, wave three always exceeds in value to 1.
The second bearish stage is composed of 3 waves called a, b and c. Each step has impulse waves and their corrective waves. The ones that go in the direction of the trend are corrective, and those that go against the trend are an impulse.
In the first bullish stage, waves 1, 3, and 5 are bullish. Therefore they are in favor of the trend and are considered impulse waves. While 2 and 4 are not bullish, so they are deemed corrective waves. In the bearish stage the waves a and c are bearish, and the b, bullish.
Elliot waves became famous for representing a map of what could happen. It is the panacea you want to know how far the price can go if you can detect the correct wave. Today it is accepted worldwide, but when it came for the first time, it was very innovative, with its detractors.
To get an overview of the Elliott wave theory, it is imperative to know at what moment of the market we are in with regards to the waves. We are always based on a temporary period of investment. So, we can anticipate the movements of the market. Elliot waves became famous because they expect movements. To understand them better we can turn to theory: The rule of an alternation.
If we maintain this premise, financial markets do not always do the same, that is, if they have resistance zones or supports, this theory maintains that these zones do not repeat themselves. When we see the theory of Elliot waves, we have to take into account three questions:
- The figure or image that the waves leave us in the graph and therefore is what we expect.
- Analysis of these issues, by which we can discern how far the price will go and especially the outputs due to the link between the waves.
- The time it takes for waves to form.
Therefore, understanding these waves, as mentioned here, can offer a good overview of the Elliott wave theory!
Comments
Post a Comment